
Home value growth eases along with competition – price relief may be on the horizon.
 Home sellers are returning to the market but finding buyers hesitating. Fresh listings of houses rose significantly over last year – outpacing sales and cooling buyer competition and home price appreciation. Zillow forecasts further price relief on the horizon – further injections of inventory and mortgage rates expected to stay elevated through the year should temper competition.
Inventory infusion
New listings from sellers took a significant step up in May, rising 8% month over month (a bit more than pre-pandemic averages) and 13% above last year’s extremely low pace. The effects of ‘rate lock,’ owners holding on to their existing homes and low-rate mortgages, appear to be lessening over time, even as most outstanding mortgages have a rate well below what’s currently being quoted on the market. A Zillow survey of recent sellers found a large majority (about 80%) were influenced by life events, such as getting married or having a child – not necessarily just by when financial conditions are optimal.
But buyers aren’t matching sellers’ uptick in activity – sales in May [1] were 6% lower than last year’s already-low volume. This helped partially restock the housing shelves – the number of homes on the market rose 22% compared to last year’s near-record-low level. Inventory is still 34% below pre-pandemic levels, but that’s the smallest deficit in more than three years.
Competition and appreciation ease
As a result, competition among buyers eased in May and home price appreciation cooled with it. Growth in the Zillow Home Value Index slowed from 4.4% year over year in April to 3.9% in May, while monthly appreciation ticked down from 1.2% in April to 0.8% in May. Home values are now 45% above what they were before the pandemic.
Renters struggling to save up for a down payment may get a slight reprieve in the coming year. Zillow forecasts home values will end 2024 up 0.4% on the year, and tick down 1.4% through May 2025.
What it means for buyers and sellers
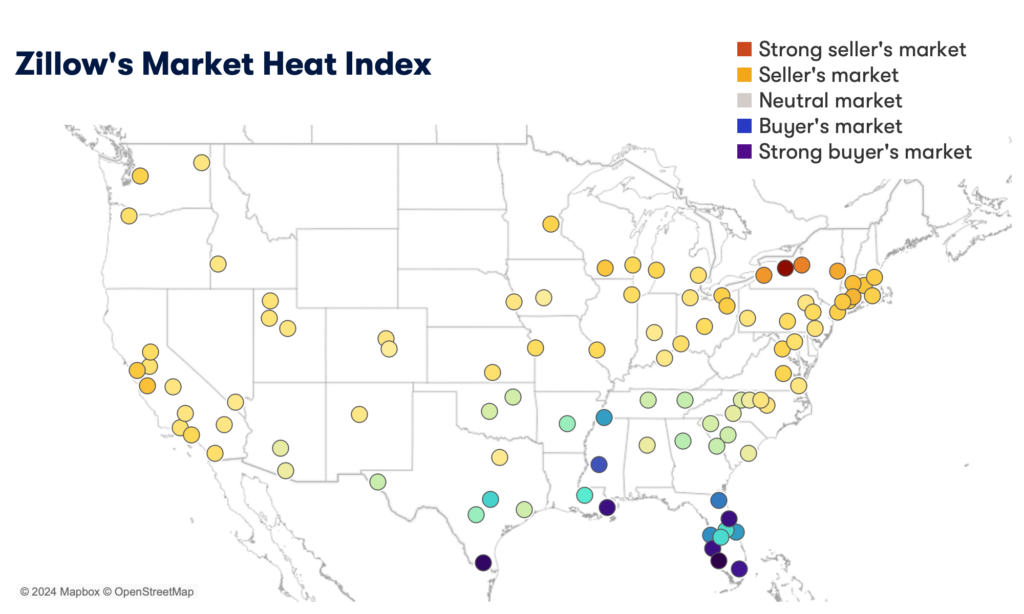
Zillow’s Market Heat Index shows the nation is becoming a bit friendlier for buyers and is headed toward ‘neutral’ territory, but sellers still hold a slight advantage. Buffalo, Hartford and San Jose are the top markets for sellers among the 50 largest metro areas. New Orleans, Miami, Jacksonville and Memphis are all tilted toward buyers, giving those in the market better leverage in negotiations.
Nationwide, nearly a quarter of all homes for sale received a price cut in May – the highest share in at least the last six years for this time of year. There’s a good chance that buyers can purchase a lingering property for less than list price. This environment makes experienced agents all the more valuable for both buyers and sellers – to find and negotiate deals for buyers, and to price and market properties correctly for sellers.
May 2024 Market Report
Home values
The value of a typical home in the U.S. is $360,310. The typical monthly mortgage payment, assuming 20% down, is $1,931.
- Home values climbed month over month in all 50 of the nation’s largest metro areas in May. Gains were biggest in Buffalo (2.1%), Pittsburgh (1.9%), Cleveland (1.8%), San Jose (1.8%), and Hartford (1.7%).
- The smallest monthly appreciation was in Austin (0.2%), Tampa (0.3%), San Antonio (0.3%), Orlando (0.3%), and New Orleans (0.4%).
- Home values are up from year-ago levels in 46 of the 50 largest metro areas. Annual price gains are highest in San Jose (12.7%), Hartford (11.6%), San Diego (11.1%), Los Angeles (8.9%), and Boston (8.3%).
- Home values are down from year-ago levels in three major metro areas. The largest drops were in New Orleans (-5.9%), Austin (-4.1%), and San Antonio (-2.2%).
- The typical mortgage payment is up 11.3% from last year and has increased by 115.3% since pre-pandemic.
Inventory & new listings
- New listings increased by 7.9% month over month in May.
- There were 12.6% more new listings compared to last year.
- New listings are still 23.3% lower than pre-pandemic levels.
- Inventory (the number of listings active at any time during the month) in May increased by 7.4% from last month.
- There were 22.1% more listings active in May compared to last year.
- Inventory levels are 33.8% lower than pre-pandemic levels for the month – the smallest deficit in more than three years.
Price cuts & share sold above list
- 23.9% of listings in May had a price cut. That’s compared to 22.4% in April and 19.3% last May.
- 33.3% of homes sold above their list price in April, up from 30.3% in March. In April 2023, 34.5% of homes sold for more than list price.
Newly pending sales
- Newly pending sales held steady in May from the prior month.
- Newly pending sales decreased by 4.2% from last year.
- Median days to pending, the typical time from initial list date to pending status for homes that went under contract during a month, is at 13 days in May, which is unchanged from April.
- Median days to pending increased by three days from last year.
Rents
- Asking rents increased by 0.6% month over month in May. The pre-pandemic average growth for this time of year is 0.7%.
- Rents are now up 3.4% from last year.
- Rents fell, on a monthly basis, in just one major metro area – Birmingham (-0.3%). They held steady in Tampa (0%) and New Orleans (0%), and rose slightly in Louisville (0.1%) and Miami (0.1%).
- Rents are up from year-ago levels in 48 of the 50 largest metro areas. Annual rent increases are highest in Providence (7.1%), Hartford (7%), Louisville (6.4%), Cleveland (6.3%), and Buffalo (6%).
[1] Tracked by Zillow’s Sales Count NowCast